🔍 TL;DR We combine independent lab testing, verified certifications, and hands-on use. Every product is scored across 7 factors: filtration performance, flow/pressure, taste & odor, install & maintenance, build quality, operating cost, and certifications/transparency.
- ⚠️ Limits of Testing: Not every claim can be lab-verified. For example, salt-free water softeners using Template Assisted Crystallization (TAC) cannot be measured by standard hardness reduction tests. In cases where no certified lab data exists, we disclose it clearly and rely on manufacturer documentation, visual checks, and long-term user feedback.
- ⚖️ Weighting by Guide: Scoring weights shift depending on the guide’s focus. A whole house filter guide emphasizes flow and chlorine removal, while a PFAS guide leans on lab-verified reduction. We always publish our basis of evidence, and update pages when new results, certifications, or product revisions appear.
💡 Our Commitment: If we can test it, we’ll show you. If we can’t, we’ll tell you
🛑 What “independent” means
- We do not sell filters and we don’t take paid placements.
- Products may be purchased retail, loaned, or provided — but manufacturers never see drafts and cannot influence scores.
- If a unit is provided for testing, we always disclose it on the review page.
- If a system fails or leaks, we test again (once). Repeat failures are documented and scored accordingly.
💡 Independence means we test on your behalf, not the manufacturer’s.
🧭 What we test (by intent)

We don’t just “test everything.” We design evaluations around what readers actually need solved.
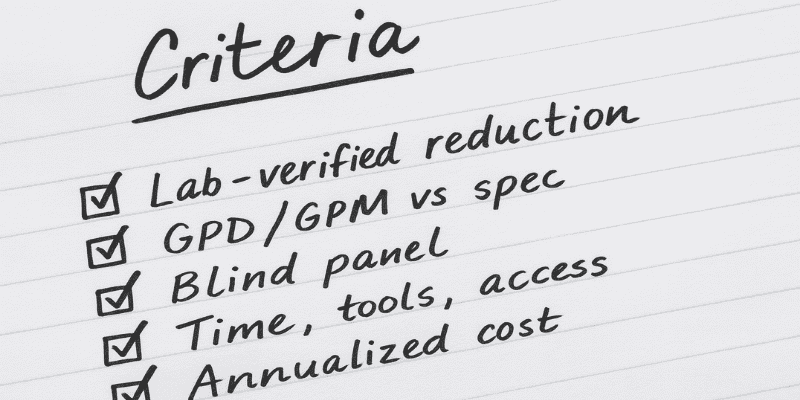
- 🔬 Microplastics: Particle counts (particles/L) and size bins where available; verify claims down to ≤0.001 µm; cross-check certifications.
- 🧴 PFAS: Short- and long-chain species where measurable; confirmed against accredited standards and recognized certifications.
- 🚿 Chlorine / Chloramine & Taste/Odor: Blind sensory panel + any available residual measurements.
- ⚒️ Heavy Metals / VOCs / Fluoride: Verified certifications and third-party reports; spot tests if reliable methods exist.
- 💨 Flow & Pressure: Real-world checks — timed 1-gallon fills, GPM/GPD measurements, and peak-demand observations.
- 🔧 Maintenance & Costs: Install effort, swap frequency, tool requirements, mess factor, and annualized replacement costs.
💡 Note: Results depend on your source water, plumbing, and usage. We test in real homes, so your numbers may differ — and that’s the point.
🧪 Our Lab & Verification Approach (Lab-Agnostic)

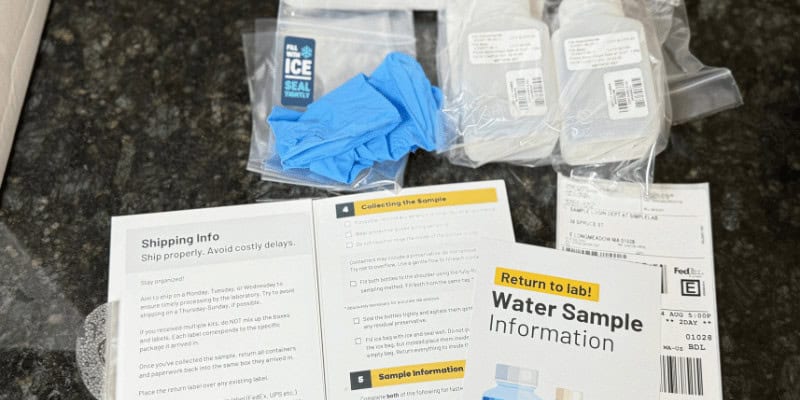
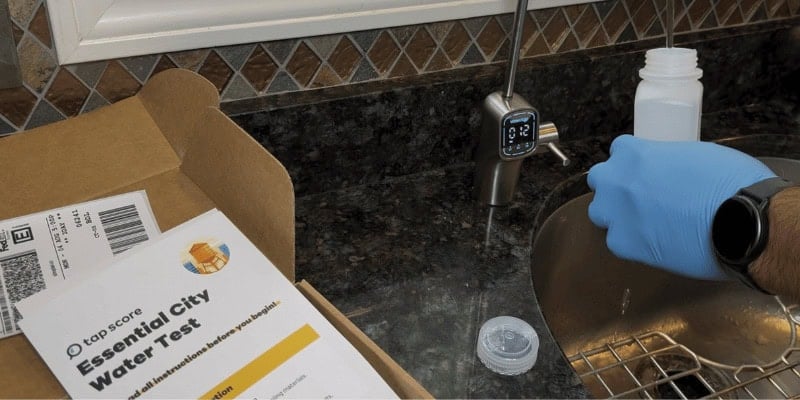
Whenever possible, we run pre- and post-installation testing through accredited laboratories. The goal is to remove bias, standardize methods, and ensure repeatability.
- 📍 Sampling Points: Cold kitchen tap for under-sink/RO, nearest whole-home tap after installation for whole-house systems.
- 🔄 Stabilization: We flush per manufacturer guidance, then capture after the system reaches a steady state.
- 📦 Containers & Shipping: Samples follow strict lab protocols — sealed containers, labeled custody chains, and time-controlled deliveries.
- 📑 Reporting: We retain original PDFs, note detection limits, and highlight anything that falls below measurable thresholds.
- 🔁 Quality Checks: Duplicates are used when possible. Outlier results are re-tested to confirm accuracy or flagged as anomalies.
When direct lab work isn’t possible, we lean on curated, verifiable sources:
- ✅ Independent third-party lab reports (NSF, ANSI, IAPMO, WQA).
- 📄 Manufacturer documentation with model-specific testing conditions.
- 🛠 Our own hands-on observations (flow rates, taste panels, installation notes).
💡 Key principle: We always label the basis of evidence on every review (lab data, certifications, or both). Transparency isn’t optional.
⭐ The 7-Factor Score Explained

Every system we review is judged across seven independent dimensions, each scored 1–5. These aren’t arbitrary stars — each factor reflects a real-world testing process or verifiable benchmark.
- 🧪 Filtration Performance — Core reduction ability. Verified by certified lab data where possible (NSF, WQA, IAPMO) and cross-checked against credible independent reports.
- 💧 Flow & Pressure — How well the system maintains usable water pressure under load. Measured by timed 1-gallon fills, GPM checks, and observed peak-demand drops.
- 🍋 Taste & Odor — Panel testing with multiple tasters. We look for chlorine notes, chemical aftertaste, or other off-flavors, as well as improvements in mouthfeel.
- 🔧 Install & Maintenance — Time, tools, mess, and swap frequency. A great filter shouldn’t require plumbing expertise every 6 months.
- 🏗 Build Quality — Fit, finish, and durability. Includes material choices, leak-resistance, tolerances, and labeling clarity.
- 💲 Operating Cost — Annualized filter/media replacement cost. We standardize around real-world intervals, not idealized “up to” claims.
- 📜 Certifications & Transparency — Verified listings (NSF/ANSI, WQA), public documentation, and manufacturer clarity. “Tested to” is not the same as “certified to.”
⚖️ Weighted Average: Not every factor carries the same importance. For example, filtration accounts for 45% of the score in most guides, while taste is weighted much lower. This ensures that critical health outcomes outweigh cosmetic perks.
💡 Pro Tip: Weighted scoring means your 4-star rating is reproducible — the math is transparent, and smaller factors can’t artificially inflate the overall rating.
Overall rating = weighted average of these 7 scores (weights vary by guide).
| Factor | Weight | Score (1–5) | Weighted Value |
|---|---|---|---|
| 🧪 Filtration Performance ⓘ | 45% | 4.0 | 1.80 |
| 💧 Flow / Pressure ⓘ | 20% | 3.5 | 0.88 |
| 🔧 Install & Maintenance ⓘ | 10% | 4.0 | 0.40 |
| 🏗 Build Quality ⓘ | 10% | 3.5 | 0.35 |
| 🍋 Taste & Odor ⓘ | 5% | 3.5 | 0.18 |
| 💲 Operating Cost ⓘ | 5% | 4.0 | 0.20 |
| 📜 Certifications & Transparency ⓘ | 5% | 3.5 | 0.18 |
| ⭐ Overall Score | — | — | 3.99 / 5 ≈ 4★ |
💡 Pro Tip: The overall score is the sum of each row’s Weighted Value (Weight × Score).
💡 Scoring Weights by Product Guide

🏠 Whole-House Water Filters (City & Well Water)
When we evaluate whole-house systems, the scoring weights shift depending on the source water.
- City water → Scoring leans on chlorine/chloramine removal and the ability to keep strong household flow when multiple taps are running.
- Well water → Scoring emphasizes reduction of specific contaminants (iron, manganese, hydrogen sulfide, tannins) while still maintaining usable pressure and manageable maintenance.
By separating city vs. well priorities, the scoring tables make it clear why a system earns the rating it does.
| Guide Type | Primary Weights | Strong vs Weak |
|---|---|---|
| City Water |
🧪 Filtration Performance 45% 🚿 Flow / Pressure 20% 🔧 Install & Maintenance 10% 🏗 Build Quality 10% 🍋 Taste & Odor 5% 💲 Operating Cost 5% 📜 Certifications & Transparency 5% |
✅ Strong → Verified chlorine/chloramine reduction + steady household flow ⚠️ Weak → Generic carbon claims or major pressure drop when multiple taps run |
| Well Water |
🎯 Target-Contaminant Performance 50% 🚿 Flow / Pressure 15% 🔧 Install & Maintenance 10% 🏗 Build Quality 10% 🍋 Taste & Odor 5% 📜 Certifications & Transparency 5% 💲 Operating Cost 5% |
✅ Strong → Lab-proven reduction of iron, manganese, or sulfur odor ⚠️ Weak → “Sediment only” systems that don’t address staining or rotten-egg smell |
💡 Pro Tip: On well water, “Target-Contaminant Performance” means removal proven by lab tests — like iron reduced below staining thresholds, or hydrogen sulfide eliminated to stop rotten-egg odor. Generic sediment filtration isn’t enough.
💧 Water Softeners (Salt-Based & Salt-Free)
For softeners, our scoring depends on the underlying process.
- Salt-based ion exchange → We measure hardness reduction in grains per gallon (gpg) and verify pressure stability.
- Salt-free (TAC/conditioners) → These can’t be tested with gpg reduction. Instead, we check for visible scale prevention on fixtures/appliances and lean on real-world observation plus any supporting documentation.
This separation avoids misleading “apples to oranges” comparisons. Each system is scored within its actual performance intent.
| System Type | Primary Weights | Strong vs Weak |
|---|---|---|
| Salt-Based Softeners |
🧪 Hardness Reduction 50% 🚿 Flow / Pressure 15% 🔧 Install & Maintenance 10% 🏗 Build Quality 10% 🍋 Taste & Odor 5% 💲 Operating Cost 5% 📜 Certifications & Transparency 5% |
✅ Strong → Documented drop in hardness (gpg) + steady pressure ⚠️ Weak → Inflated capacity claims or excessive salt/water use |
| Salt-Free (TAC/Conditioners) |
🎯 Scale Prevention 50% 🚿 Flow / Pressure 15% 🔧 Install & Maintenance 10% 🏗 Build Quality 10% 🍋 Taste & Odor 5% 💲 Operating Cost 5% 📜 Transparency 5% |
✅ Strong → Real-world prevention of scale on fixtures/appliances ⚠️ Weak → Marketed as “softeners” but don’t lower hardness gpg |
💡 Pro Tip: Salt-free systems should always be labeled as “conditioners” or “descalers,” not true softeners. If you still measure 18 gpg hardness before and after, that’s normal — the win is reduced scale, not softer water.
⚙️ Reverse Osmosis (RO Systems)
RO systems are designed for broad-spectrum contaminant reduction. Because they filter at the molecular level, our testing puts the most weight on lab-verified filtration performance and certifications, while still checking flow, taste, and usability.
- Tank-based RO → We measure refill speed, usable storage, and check reduction against NSF/ANSI 58 standards.
- Tankless RO → We verify gallons per day (GPD), flow stability, and pump reliability under real household use.
| System Type | Primary Weights | Strong vs Weak |
|---|---|---|
| Tank-Based RO |
🧪 Filtration Performance 45% 🚿 Flow / Pressure 20% 🔧 Install & Maintenance 10% 🏗 Build Quality 10% 🍋 Taste & Odor 5% 💲 Operating Cost 5% 📜 Certifications & Transparency 5% |
✅ Strong → Verified reduction of PFAS, nitrates, lead, fluoride, etc. ⚠️ Weak → Slow refill rate if tank empties; space needed under sink |
| Tankless RO |
🧪 Filtration Performance 45% 🚿 Flow / Pressure 20% 🔧 Install & Maintenance 10% 🏗 Build Quality 10% 🍋 Taste & Odor 5% 💲 Operating Cost 5% 📜 Certifications & Transparency 5% |
✅ Strong → High flow (400–800 GPD) + continuous supply ⚠️ Weak → Pump failures or reduced pressure at multiple taps |
💡 Pro Tip: TDS meters are not a complete purity scoreboard — they only measure dissolved solids, not PFAS or microplastics. Always look for NSF/ANSI 58 or equivalent certifications when comparing RO systems.
🧪 PFAS Filters
PFAS reduction is one of the toughest claims to verify. We prioritize third-party lab results and active certifications (NSF/ANSI 53 or equivalent). When possible, we test both short- and long-chain PFAS compounds. If no lab data exists, we flag it clearly and score transparency lower.
- “Tested to” or vague claims → Scores low.
- Verified PFAS reduction → Scores high.
| System Type | Primary Weights | Strong vs Weak |
|---|---|---|
| Dedicated PFAS Filters |
🧪 Filtration Performance 60% 📜 Certifications & Transparency 10% 🚿 Flow / Pressure 10% 🔧 Install & Maintenance 5% 🏗 Build Quality 5% 🍋 Taste & Odor 5% 💲 Operating Cost 5% |
✅ Strong → Verified reduction for multiple PFAS species (PFOA, PFOS, GenX) with recognized lab reports ⚠️ Weak → “Tested to” claims with no active NSF/ANSI P473 or equivalent certification |
💡 Pro Tip: PFAS reduction should always be documented with chain-of-custody lab reports. Be cautious of filters that only reference “internal testing” or generic spec sheets — real credibility comes from third-party certification.
🧩 Microplastics Filters
Microplastics aren’t yet regulated, so we look for particle-count testing (before/after samples) or certifications that verify pore size ≤0.001 µm. Flow is closely monitored since microplastic-capable filters often trade speed for precision.
- Generic “1 micron” marketing with no data = low score.
- Lab-proven particle removal across size ranges = high score.
| System Type | Primary Weights | Strong vs Weak |
|---|---|---|
| Microplastics Filters |
🧪 Filtration Performance 50% 📜 Certifications & Transparency 15% 🚿 Flow / Pressure 15% 🔧 Install & Maintenance 5% 🏗 Build Quality 5% 🍋 Taste & Odor 5% 💲 Operating Cost 5% |
✅ Strong → Particle count reduction across multiple size bins (e.g., 1–5 µm, 20–100 µm) ⚠️ Weak → Claims of “removes microplastics” with no lab data or only micron rating marketing |
💡 Pro Tip: A filter can claim “1 micron” on paper, but without verified third-party results, you don’t know how well it holds that performance over time. Look for independent pre/post testing or certifications that validate particle retention.
🫗 Filter Pitchers
Pitchers are tested for chlorine/taste improvement, contaminant reduction, and filter life. Because capacity is small, we run repeated cycles to see how performance holds up as the cartridge nears the end of life. NSF/ANSI 42, 53, or 401 certifications are checked against listings.
| System Type | Primary Weights | Strong vs Weak |
|---|---|---|
| Filter Pitchers |
🧪 Filtration Performance 40% 📜 Certifications & Transparency 20% 🍋 Taste & Odor 15% 💲 Operating Cost 10% 💧 Flow / Pressure 5% 🔧 Install & Maintenance 5% 🏗 Build Quality 5% |
✅ Strong → Certified PFAS, lead, or chlorine reduction + noticeable taste improvement. ⚠️ Weak → “Taste only” claims with no certification, filters that clog fast, or marketing that hides replacement costs. |
💡 Pro Tip: With pitchers, filter replacement costs add up fast. Always check the certified contaminant list and calculate the true yearly cost — not just the upfront price.
🚿 Shower Filters
Shower filters are about comfort, not drinking water. We test for chlorine/chloramine reduction (NSF/ANSI 177 if available), check real-world flow with timed fills, and monitor durability of housings. Skin/hair feel and odor reduction are also panel-tested.
| System Type | Primary Weights | Strong vs Weak |
|---|---|---|
| Shower Filters |
🧪 Filtration Performance 35% 🚿 Flow / Pressure 25% 🏗 Build Quality 15% 🔧 Install & Maintenance 10% 🍋 Taste & Odor (Aroma/Feel) 5% 💲 Operating Cost 5% 📜 Certifications & Transparency 5% |
✅ Strong → Noticeable chlorine reduction (smell & feel), durable housing, maintains good flow. ⚠️ Weak → Cosmetic-only cartridges, short lifespan, or filters that drop water pressure. |
💡 Pro Tip: For shower filters, the “test” is often skin and hair feel + chlorine smell. NSF/ANSI 177 certification is a strong sign it’s not just a gimmick.
🧊 Refrigerator Filters
Fridge filters are tested against their certification claims (NSF/ANSI 42, 53, 401). We measure flow rate (cold dispensing speed), taste improvement, and cartridge lifespan. Since many generics skip certification, we verify active listings for every model.
| System Type | Primary Weights | Strong vs Weak |
|---|---|---|
| Refrigerator Filters |
🧪 Filtration Performance 40% 📜 Certifications & Transparency 20% 💧 Flow / Pressure 15% 💲 Operating Cost 10% 🔧 Install & Maintenance 10% 🏗 Build Quality 5% |
✅ Strong → NSF/ANSI 42 & 53 certified for chlorine, taste, and health contaminants. ⚠️ Weak → Generic or “compatible” filters with no certification, or filters that clog quickly. |
💡 Pro Tip: Many third-party “compatible” fridge filters skip certifications to cut costs. Always check for active NSF listings — and note that genuine filters usually have higher flow and longer lifespans.
🥛 Countertop Filters
Countertop filters are judged on ease of setup, flow rate, and contaminant reduction. If it’s a carbon block, we measure chlorine/taste performance. If it’s a countertop RO, we check flow stability, TDS reduction, and certifications. Portability and daily usability also count.
| System Type | Primary Weights | Strong vs Weak |
|---|---|---|
| Countertop Filters |
🧪 Filtration Performance 45% 🚿 Flow / Pressure 20% 🔧 Install & Maintenance 10% 🏗 Build Quality 10% 📜 Certifications & Transparency 10% 💲 Operating Cost 5% |
✅ Strong → Multi-stage filtration, real certifications, good flow for cooking & drinking. ⚠️ Weak → Cosmetic-only carbon cartridges, unverified claims, or clunky design that clogs the sink. |
💡 Pro Tip: Countertop systems are often a stepping stone to RO. If you see certifications beyond just chlorine taste & odor, that’s a big plus.
🚰 Faucet-Mount Filters
We test faucet filters by timing flow, measuring pressure drop, and checking contaminant reduction against claims. Because these filters see daily wear, build quality (switches, threads, seals) is closely inspected. Certifications are verified; vague “tested to” language scores lower.
| System Type | Primary Weights | Strong vs Weak |
|---|---|---|
| Faucet-Mount Filters |
🧪 Filtration Performance 40% 📜 Certifications & Transparency 20% 💧 Flow / Pressure 15% 🔧 Install & Maintenance 10% 🏗 Build Quality 10% 💲 Operating Cost 5% |
✅ Strong → NSF/ANSI 42 & 53 certifications, solid build, easy cartridge swaps. ⚠️ Weak → Weak flow, short filter lifespan, marketing-only claims with no verification. |
💡 Pro Tip: Faucet filters are only as good as their certifications. If it’s not tested for lead or PFAS, assume it’s just a chlorine/taste filter.
🔽 Undersink Filters
Undersink systems are tested through dedicated faucet samples. We measure flow at the tap, verify certifications (NSF/ANSI 42, 53, or 401), and document installation steps. Build quality, cartridge change frequency, and annualized cost are factored into the score.
| System Type | Primary Weights | Strong vs Weak |
|---|---|---|
| Undersink Filters |
🧪 Filtration Performance 45% 📜 Certifications & Transparency 20% 🏗 Build Quality 15% 🔧 Install & Maintenance 10% 💲 Operating Cost 5% 💧 Flow / Pressure 5% |
✅ Strong → NSF/ANSI 42, 53, or 401 certifications, solid housings, and long-lasting cartridges. ⚠️ Weak → Generic imports with vague claims, flimsy fittings, or filters that need monthly replacement. |
💡 Pro Tip: Many undersink systems look the same on the outside. Always check certification listings and cartridge lifespan — those two details separate a top-tier system from a cheap clone.
📜 Certifications & Standards Explained

Independent certifications matter because they verify a filter actually performs as claimed. We rely on three accredited bodies:
- NSF International — View all NSF/ANSI standards
- Water Quality Association (WQA) — WQA Gold Seal Directory
- IAPMO R&T — IAPMO Certified Products
Each organization maintains a public database where you can look up a filter by model number and confirm its certification status.
| Certification | What It Covers | Why It Matters |
|---|---|---|
| NSF/ANSI 42 | Chlorine, taste, odor, particulates (aesthetic only) | Improves taste & smell but does not address health contaminants |
| NSF/ANSI 53 | Health-related contaminants (lead, VOCs, cysts, heavy metals, some PFAS) | One of the most important standards for safe drinking water |
| NSF/ANSI 58 | Reverse osmosis systems (TDS reduction, membrane performance, PFAS reduction) | Assures the RO unit is effective & reliable for both TDS and health contaminants |
| NSF/ANSI 401 | Emerging contaminants (pharmaceuticals, pesticides, BPA, microplastics, trace chemicals) | Covers modern concerns not addressed by older standards |
| WQA Gold Seal | Independent certification for water treatment products, aligned with NSF standards | Trusted alternative to NSF, often used for softeners, filters, and media |
| IAPMO R&T | Plumbing & water treatment certifications (includes NSF/ANSI standards) | Another accredited third-party body verifying compliance |
💡 Pro Tip: Marketing phrases like “tested to NSF standards” ≠ certified. Always verify the model on an official database.
🔍 How to Verify a Certification

Not sure if a filter is really certified? Here’s how you can check it yourself:
1️⃣ Go to the right database
2️⃣ Search by brand + model number
- Example: type in “Aquatru” or “Brita OB03.”
- Be exact — many brands have multiple models.
3️⃣ Check the active listing
- Look for the NSF/ANSI standard number (42, 53, 58, 401, etc.).
- Confirm the status is active and not expired.
4️⃣ Match it to your box/manual
- Make sure the filter you’re buying is the same model listed.
- Beware of lookalike or older versions still being sold online.
💡 Pro Tip: If a product only says “tested to NSF standards” but doesn’t show up in these databases, it’s not certified.
📘 Glossary of Water Filter Terms

- Micron (µm): One-millionth of a meter. Smaller = finer filtration. For example, 0.5 µm filters catch many bacteria, while 0.0001 µm RO membranes stop PFAS and salts.
- TDS (Total Dissolved Solids): A measure of salts and minerals. Useful for checking RO function, but not a complete measure of water safety.
- GPM (Gallons Per Minute): Flow rate for whole-house systems (how much water can move at once).
- GPD (Gallons Per Day): Flow rate for reverse osmosis systems (how much purified water can be made in 24 hours).
- NSF/ANSI Standards: Independent certifications for safety, performance, and contaminant reduction. (42 = taste/odor, 53 = health effects, 58 = RO, 401 = emerging contaminants).
- Activated Carbon: A porous media that adsorbs chlorine, VOCs, and many organics. Common in pitcher and undersink filters.
- Ion Exchange: A process used in softeners and some filters that swaps unwanted ions (like calcium, magnesium, lead) for sodium or hydrogen.
- TAC (Template Assisted Crystallization): Salt-free softener process that changes scale-forming minerals into crystals so they don’t stick to pipes — can’t be measured by hardness tests, only visual scaling results.
💡 Helpful to know: Glossary terms are kept in plain English. If a brand uses jargon, check here first before believing marketing claims.
 124 people found this helpful. Was this guide helpful to you?

